-
We Are Business Intelligence
Actionable Charting and Reporting Built by Industry Experts
You Can’t Fix What You Don’t Measure
Jack Welch, the former CEO of General Electric, famously said: “You can’t fix what you don’t measure, so you’ve got to measure everything.” SalesChain’s business intelligence utility was built with this principle in mind. Since SalesChain serves as a repository of information for our customer’s forecasting, sales, MIF, lease portfolio, achievement, fulfillment, and order pricing information, it was a natural progression for us to build a utility to display this information in a comprehensive, but easy to understand way. Our business intelligence platform combines complex data and ease of use into a tool that helps you grow your business.


One System Means Complete, Accurate Data
It is challenging to achieve complete, accurate data with a dashboarding tool. Especially if that tool is not integrated directly with the source for the data which it serves to view. SalesChain has a unique advantage when it comes to data accuracy since sales rep activity, leasing activity, service activity, and more are all being logged in our system already. Since we have the data, we can very easily add it directly to your charting tools. This means no cross-pollination or manual entry across disparate systems, eliminating potential points of error.
Create Dashboards From 350+ Charts
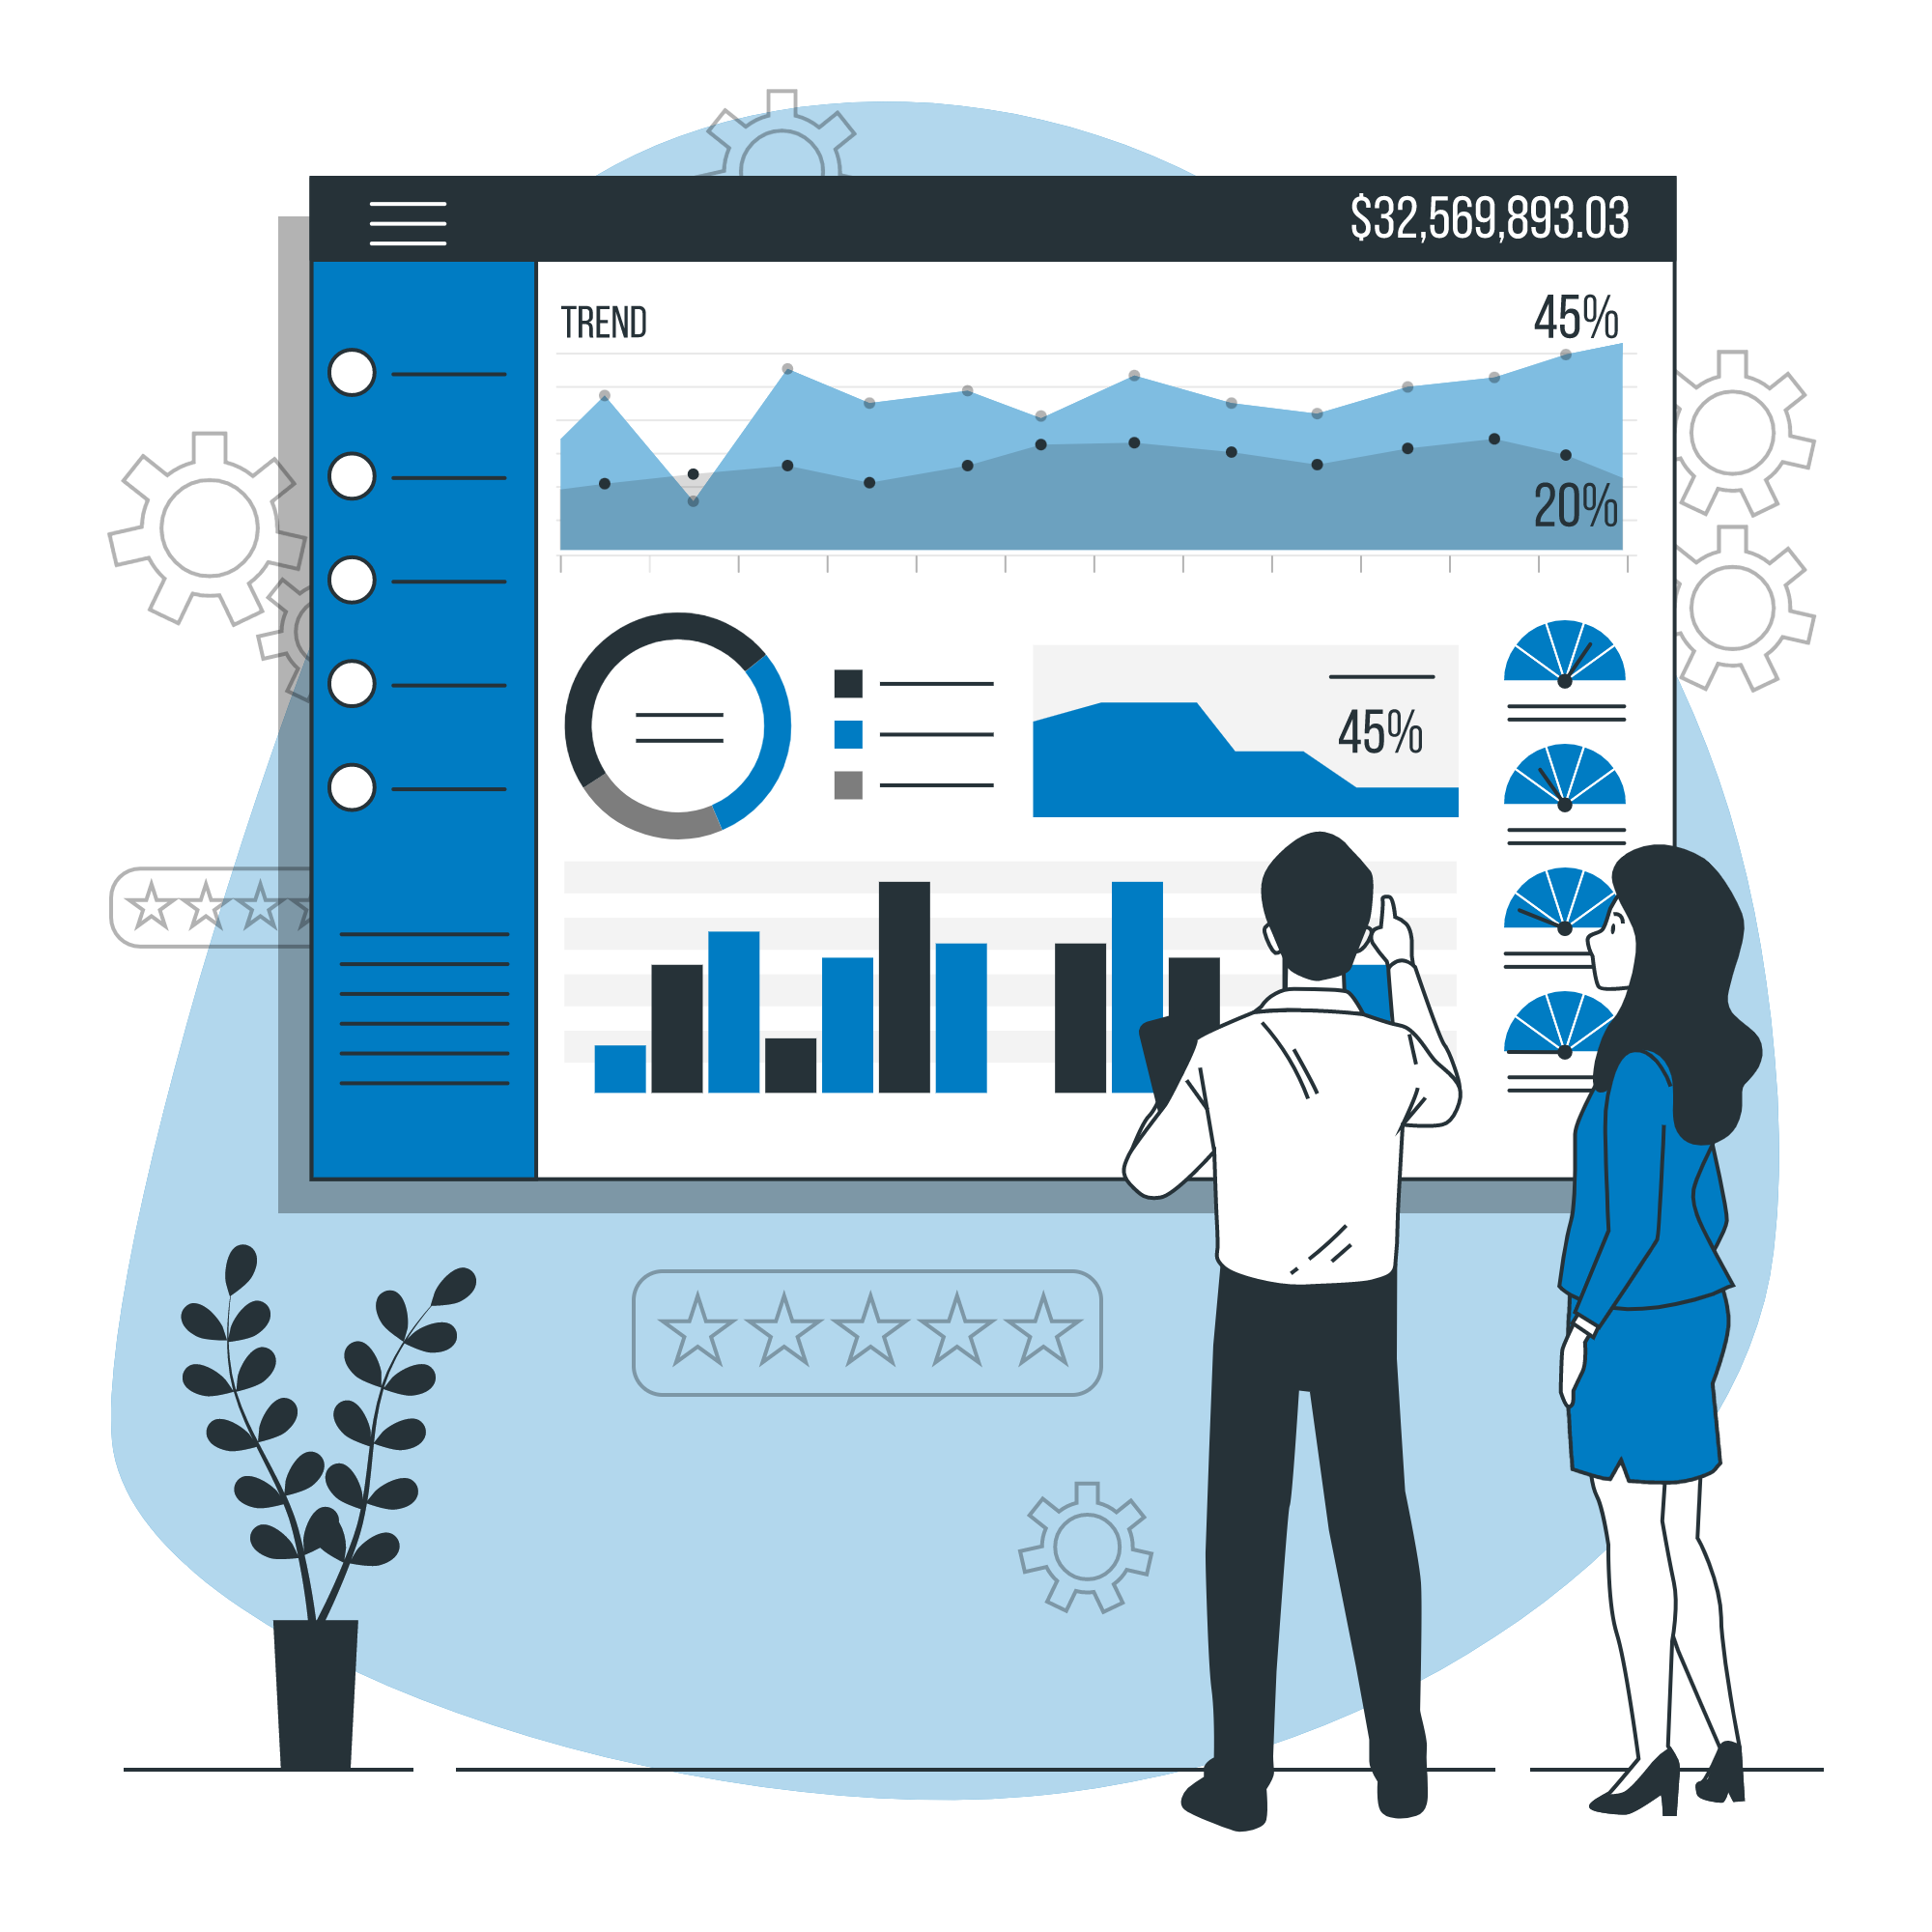
One of the most critical components of business intelligence tools is the ability to view complex information in a helpful way. SalesChain’s business intelligence tool allows you to build your own custom dashboards. Choosing from our library of over 350 charts and reports, you can lay out information in a way that makes the most sense for you. Keep these dashboards private or share them with others in your workforce!

350+
Individual Charts
75
Unique KPI’s
∞
Custom Dashboards

Interpret, Audit and Act
Each chart in our business intelligence platform is associated with a detailed audit report. With a single click, you can view a report of the information that is populating any given chart. This can help to build trust in your data set. Additionally, it gives SalesChain users the ability to take action on trouble areas by inserting tasks to prompt action. After all, it’s not just about viewing information, it’s about using the information to inform decisions and direct action.
Drive Revenue With Data
As businesses, we need to be revenue driven in the way we manage our data. With modern technology, we’ve been blessed with the ability to track data at an enterprise scale with the click of a button. Business intelligence tools and reporting put the big picture in the big data that helps most modern companies grow. Using tools that gather data on every deal in a central location is essential for forecasting and financial reporting.


Built for Dealerships Like Yours
Office technology dealerships have a unique conglomerate of CRM, ERP, leasing and operational data which only an industry-focused provider like SalesChain is poised to offer. Moreover, if there are additional charts or reports that your business wants, we would be happy to consult on and potentially build them.
